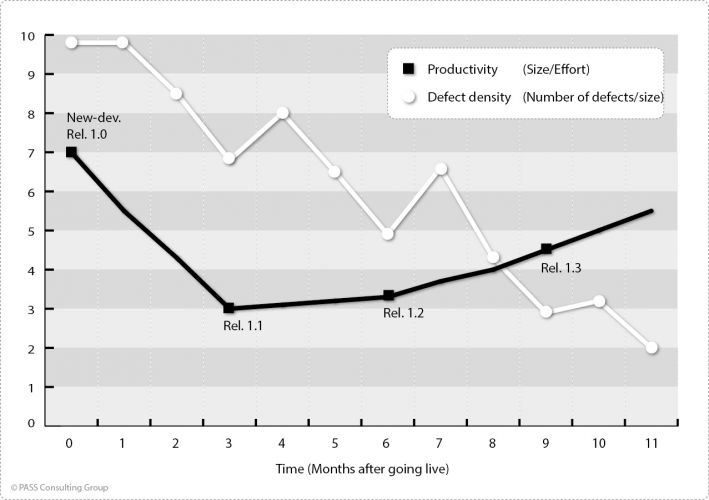
Usual time course of defect density and productivity in a XY diagram (example)
Usual time course of defect density and productivity in a XY diagram (example)
Usual time course of defect density and productivity in a XY diagram (example)
Usual time course of defect density and productivity in a XY diagram (example)