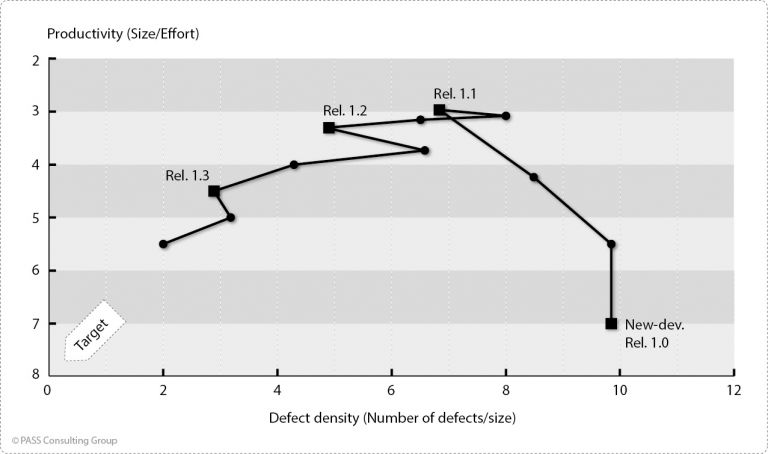
Usual time course of defect density and productivity in an XY diagram in case of neglected analytical QA (example)
Usual time course of defect density and productivity in an XY diagram in case of neglected analytical QA (example)
Usual time course of defect density and productivity in an XY diagram in case of neglected analytical QA (example)
Usual time course of defect density and productivity in an XY diagram in case of neglected analytical QA (example)