
In the field of software product development, PASS has a proven track record of both productivity and quality. Once measurement methods have been established, productivity for each release or period of time can be calculated easily, sometimes even automatically, on the basis of the developed functional size and the personnel expenditure required for this. We use the number of production errors as a quality indicator adjusted for causes such as misuse, new requirements, problems in the operating infrastructure, etc.
>> Looking for Travel Technology? : Connect with Sales

A selective measurement of productivity can be very disappointing in software development. For a longer period of time, valid statements involve consideration.
I outlined how the leadership model used for several years at PASS works in one of my prior contributions. In short: it is based on three main indices of performance (productivity, cost and quality) and the respective techniques of measurement. The productivity of a development process is calculated by measuring the developed functional size and the required personnel expenses. In addition, quality is also measured. Now it is about the information obtained by cyclically collecting key performance indicators (KPIs) over a longer period of time.
In a single cycle of the management model, the KPIs collected tell us what productivity, costs and quality are at the time of their collection – relative to a baseline or the key figures of other systems or organizational units. However, another important source of information is the course of these key figures over several cycles.
If you enter the regularly collected measured values for productivity and quality in a simple diagram, the effects of numerous influences can be seen:
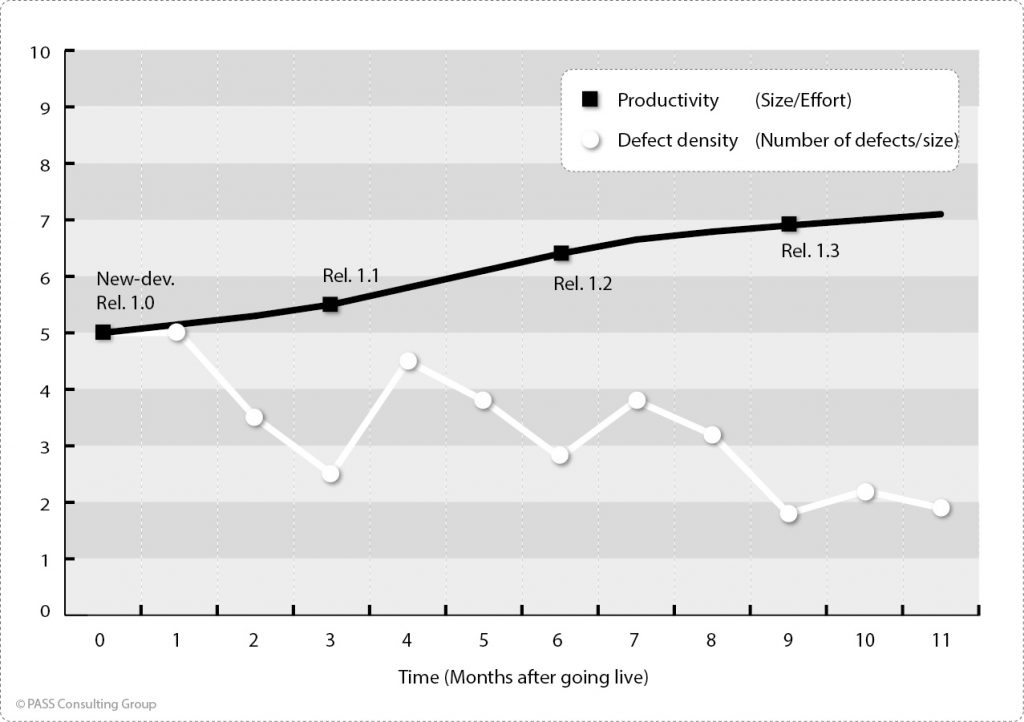
In this example, productivity increases with each new release that is put into production. This is an indicator that the team or the shop learns and constantly improves. Before Release 1.0, improvements may have been implemented whose effectiveness can now be verified by the curve progression. The course of the error curve shows that the number of errors increases after each new release which is a “normal” effect, but this trend reverses after one month at the latest and the number of production errors decreases in the long run. The interpretation: New releases contain new functionality and therefore carry a higher risk of errors. With increasing time the application matures, fewer new errors are added and the application becomes more maintainable.
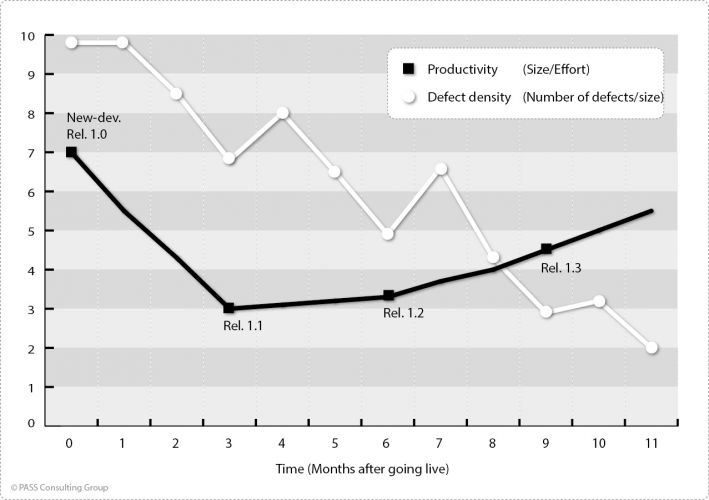
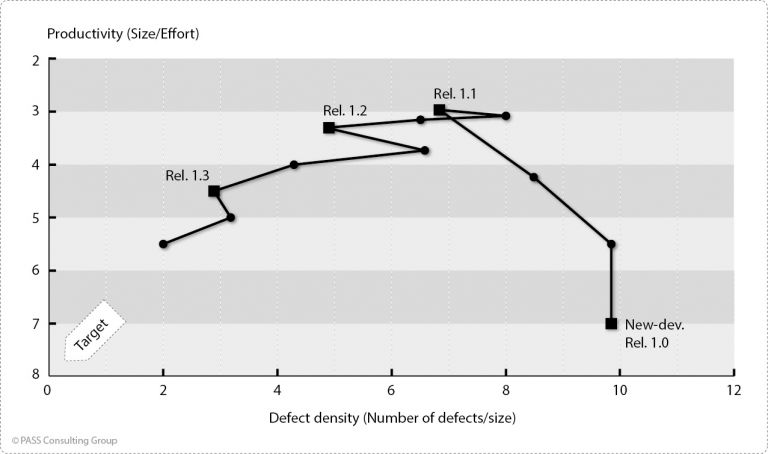
When displaying productivity and quality using two separate graphs, their mutual dependencies are not clear. Differently, when productivity and quality are plotted as dimensions in an X/Y diagram:
Unplanned influences become obvious
Many unplanned and unexpected influences only become obvious when the time course of productivity and quality is visualized in an X/Y diagram. The following diagram shows a case study in which release 1.0 of a system, which has been newly developed with good productivity (seven DIP/MD), is put into production and attracts negative attention by a bad error rate (ten defects/kDIP). The subsequent releases will successively reduce the error rate, but they are characterized by a significantly lower productivity.
Such a time course indicates that analytical quality assurance was neglected in the context of the new development. The test effort saved in this way initially results in a high productivity value. Ultimately, the test is carried out by the first users of the system, who discovered a high number of errors. The effort required to correct these numerous errors is incorporated into the productivity measurements of the next releases and leads to low productivity values. If such a course of the measured values points to neglected respectively delayed quality assurance and if this can be verified, control measures have to be initiated urgently, because on the one hand there is a bad quality impression with the users of the system, on the other hand the total costs are due to the late error corrections in the sum significantly higher compared to appropriate tests before going live.
The case study shows that a single selective measurement of productivity can be very deceptive. Over a longer period of time, the productivity for the further development of this system is suddenly low again. Only a comparison of the quality provides indications of the cause. There is an urgent need for action if the curve in such an X/Y diagram does not approach the target range of high productivity and good quality with increasing time. Such a development may indicate that the system is hard to maintain and that maintainability is deteriorating.